| Science and Engineering |
| Spectra | Lab Report |
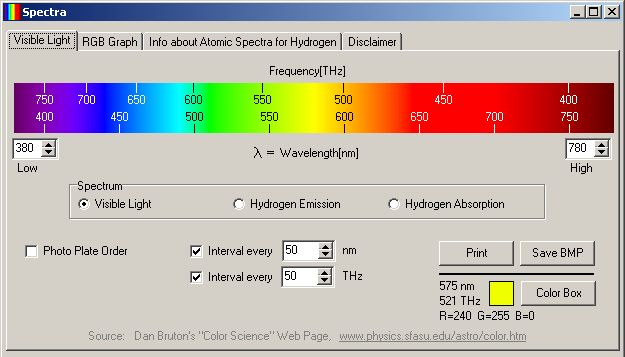
| Visible Light Spectrum and Hydrogen
Emission/Absorption Spectra Linear wavelength values [nm] are shown along the bottom edge; non-linear frequency values [THz] are shown along the top edge | ||
 |
||
 |
||
Purpose
The
purpose of this program is to display RGB colors as a function of wavelength for
visible light (380 to 780 nm). A secondary purpose of this program is to display
the emission and absorption spectra of hydrogen. The upper and lower wavelength
limits for the spectrum can be interactively specified, and interval marks can
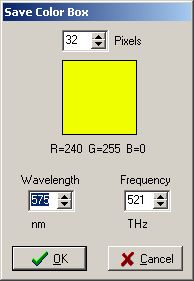
be displayed if desired. A spectrum can be printed or saved to a 24-bit color
BMP file.
Disclaimer
There is no unique one-to-one
mapping between wavelength and RGB values. Color is
a wonderful combination of physics and human perception. Please consult a
textbook, such as Principles
of Color Technology by
Billmeyer and Saltzman, for a better understanding of color. In
particular, I like the way Billmeyer explains color as the product of three
curves, since color requires a light source, an object and an observer.
The values shown in this project should only be used as approximate colors, for
example, in false
color schemes.
Materials and Equipment
Software Requirements
Windows 95/98/2000
Delphi 3/4/5 (to recompile); need "Professional" version for TChart componentHardware Requirements
Best when run with a high color or true color display (but will work with only a 256-color display).
Procedure
| Wavelength[nanometers] | 400 | 450 | 500 | 550 | 600 | 650 | 700 | 750 |
| Frequency[terahertz] | 749 | 666 | 600 | 545 | 500 | 461 | 428 | 400 |
Discussion
The WaveLengthToRGB function is based on Dan Bruton's work
(www.physics.sfasu.edu/astro/color.html) and is in the file SpectraLibrary.PAS, which is part of the
download set:
PROCEDURE WavelengthToRGB(CONST Wavelength:  Nanometers;
                          VAR R,G,B:  BYTE);
CONST
Gamma = 0.80;
IntensityMax = 255; VAR
Blue : DOUBLE;
factor : DOUBLE;
Green : DOUBLE;
Red : DOUBLE; FUNCTION Adjust(CONST Color, Factor: DOUBLE): INTEGER;
BEGIN
IF Color = 0.0
THEN RESULT := 0 // Don't want 0^x = 1 for x <> 0
ELSE RESULT := ROUND(IntensityMax * Power(Color * Factor, Gamma))
END {Adjust};BEGIN CASE TRUNC(Wavelength) OF
380..439:
BEGIN
Red := -(Wavelength - 440) / (440 - 380);
Green := 0.0;
Blue := 1.0
END; 440..489:
BEGIN
Red := 0.0;
Green := (Wavelength - 440) / (490 - 440);
Blue := 1.0
END; 490..509:
BEGIN
Red := 0.0;
Green := 1.0;
Blue := -(Wavelength - 510) / (510 - 490)
END; 510..579:
BEGIN
Red := (Wavelength - 510) / (580 - 510);
Green := 1.0;
Blue := 0.0
END; 580..644:
BEGIN
Red := 1.0;
Green := -(Wavelength - 645) / (645 - 580);
Blue := 0.0
END; 645..780:
BEGIN
Red := 1.0;
Green := 0.0;
Blue := 0.0
END; ELSE
Red := 0.0;
Green := 0.0;
Blue := 0.0
END; // Let the intensity fall off near the vision limits
CASE TRUNC(Wavelength) OF
380..419: factor := 0.3 + 0.7*(Wavelength - 380) / (420 - 380);
420..700: factor := 1.0;
701..780: factor := 0.3 + 0.7*(780 - Wavelength) / (780 - 700)
ELSE factor := 0.0
END; R := Adjust(Red, Factor);
G := Adjust(Green, Factor);
B := Adjust(Blue, Factor)
END {WavelengthToRGB}; |
The product of wavelength and frequency gives the speed of light, c = 2.9979 x 10⁸ m/sec. Given the linear wavelengths (in nanometers) on the Visible Light tabsheet, the frequency values are computed (in TeraHertz). While the wavelengths in the spectrum bitmap are linear, the frequencies are not.
The wavelengths of the Balmer series for n = 3 to 9 are calculated once by the FormCreate method.
The Balmer emission spectra for hydrogen is computed from this formula:
where n = 3, 4, 5, ...
The general hydrogen emission series can be computed from this formula:
where
RH = Rydberg Constant for Hydrogen = 10,967,757.6 m-1.
n=k+1, k+2, k+3, ...
and k is defined in the following table:
| k | Name | Wavelenth Range |
| 1 | Lyman | ultraviolet |
| 2 | Balmer | near ultraviolet and visible |
| 3 | Paschen | infrared |
| 4 | Brackett | infrared |
| 5 | Pfund | infrared |
For additional details of the hydrogen spectra (and other atoms and molecules) see a good physics book, such as Quantum Physics of Atoms, Molecules, Solids, Nuclei, and Particles (2nd edition) or Quantum Chemistry (5th edition).
Most changes in the user interface result in a call to UpdateImage. If the hydrogen emission/absorption spectrum is to be displayed (see below), a set of flags for each pixel column is set to tell if each column is in the Balmer series. Then each pixel column of the spectrum area is considered. The wavelength associated with each pixel column is calculated based on the upper and lower wavelength limit being displayed. The R, G, B components are calculated for the wavelength associated with the pixel column. Changes are made to the R, G, B assignment depending on the type of spectrum being displayed.
|
Hydrogen Absorption Spectrum (Balmer Series) |
 |
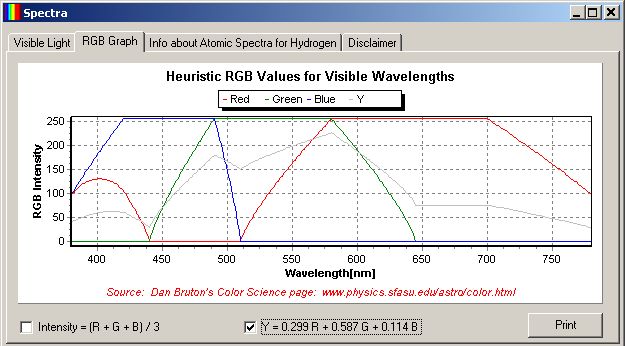
The TChart component was used to display the R, G, B functions of wavelength. This requires quite a bit of setup work in Delphi design mode, but only the single FOR loop in the FormCreate method to create the data points for the graph.
The spectrum is always printed 6 inches wide with a height to match the aspect ratio on the screen. The StretchDIBits Windows API call was used to make sure colors look good on any printer.
The Brightness, Y, shown in the graph on the RGB tab was computed using the formula:
Y = 0.299R + 0.587G + 0.114B
The coefficients in this equation properly compute the luminance for monitors having phosphors that were contemporary at the introduction of NTSC television in 1953. Contemporary CRT phosphors are standardized today with CIE luminance from linear red, green and blue to be:
Y = 0.212671R + 0.715160G + 0.072169B
See Charles Poynton's FAQ about Color and Gamma, section C-9 for more information: http://www.poynton.com/
See Paul Bourke's Spectrum image:
http://astronomy.swin.edu.au/~pbourke/colour/images/wavelength.jpeg
See how to use a "Rainbow" to color Lyapunov Exponents, which includes a slightly newer SpectraLibrary but requires Delphi 4.
For information about Color Science, see efg's Color Reference Library pages.
Conclusions
The WaveLengthToRGB function in the SpectraLibrary.PAS
unit will be very useful in assigning colors to visible wavelengths of light, or
any many applications needing false colors.
Keywords
Visible Light
Spectrum, Hydrogen Emission Spectrum, Balmer Series, Hydrogen Absorption
Spectrum, WavelengthToRGB function, TChart, Scanline, TRGBTripleArray, Print
BMP, StretchDIBits, OnMouseMove, GetRValue, GetGValue, GetBValue
References
Dan Bruton's
Color Science page, www.physics.sfasu.edu/astro/color.html
Rendering Spectra, http://mintaka.sdsu.edu/GF/explain/optics/rendering.html
John Walker's Colour Rendering of Spectra, www.fourmilab.ch/documents/specrend
Mitchell
N Charity's comments about this article
Don KlipStein's Spectra, www.misty.com/~don/spectra.html
Download
Delphi 3/4/5
Source and EXE (236 KB): Spectra.ZIP
Delphi 3 EXE: 435 KB
Delphi 4 EXE: 543 KB
Delphi 5 EXE: 578 KB
Updated 11 Sep 2004
since 1 Nov
98